使用 Flask 创建 Web 应用程序
最后修改时间:2023 年 11 月 13 日本教程介绍如何使用 Flask Web 框架开发基于 Web 的应用程序。我们的 MeteoMaster 应用程序处理存储在数据库中的气象数据,并以以下图表的形式呈现:
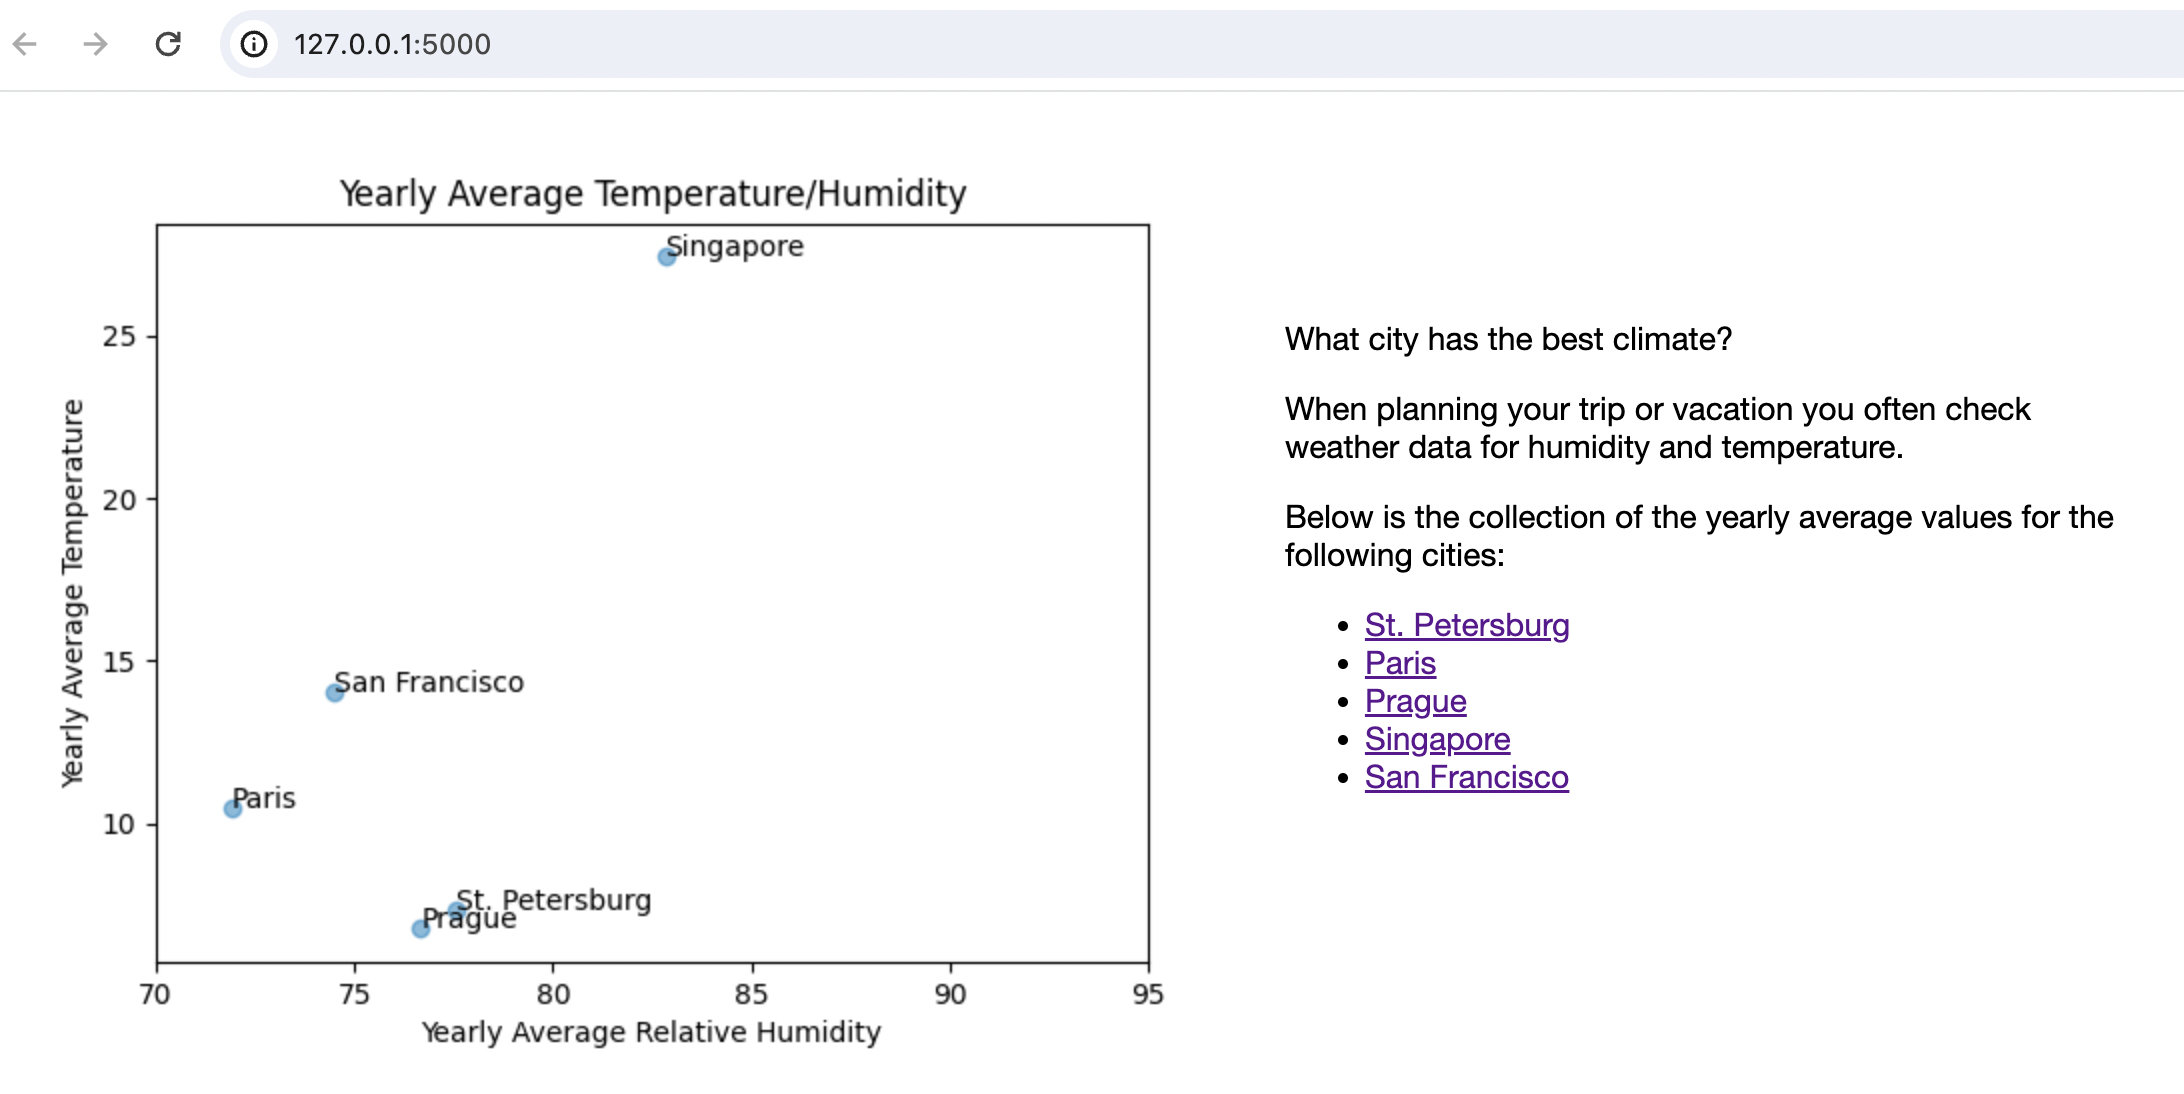
散点图 — 布拉格、圣彼得堡、旧金山、巴黎和新加坡年平均气温和湿度的累积报告。
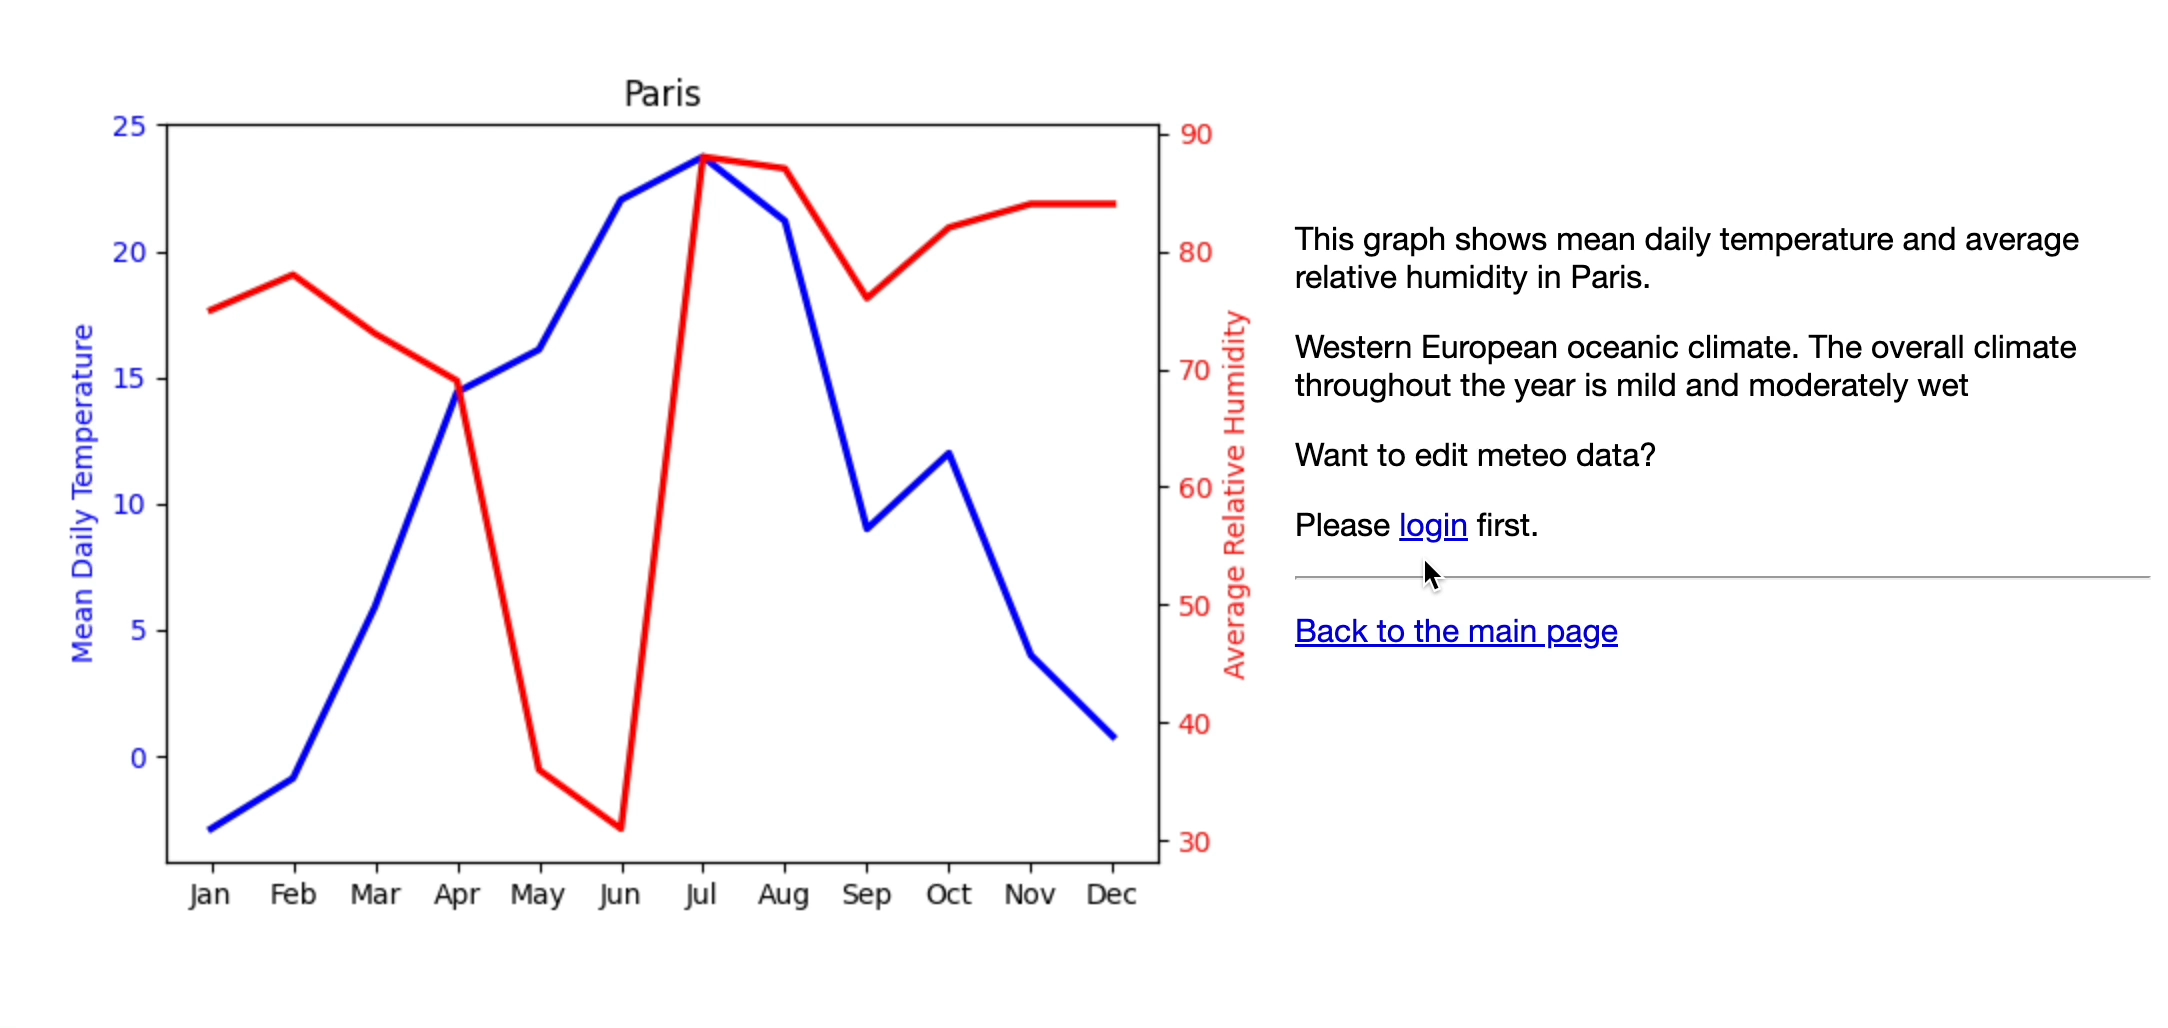
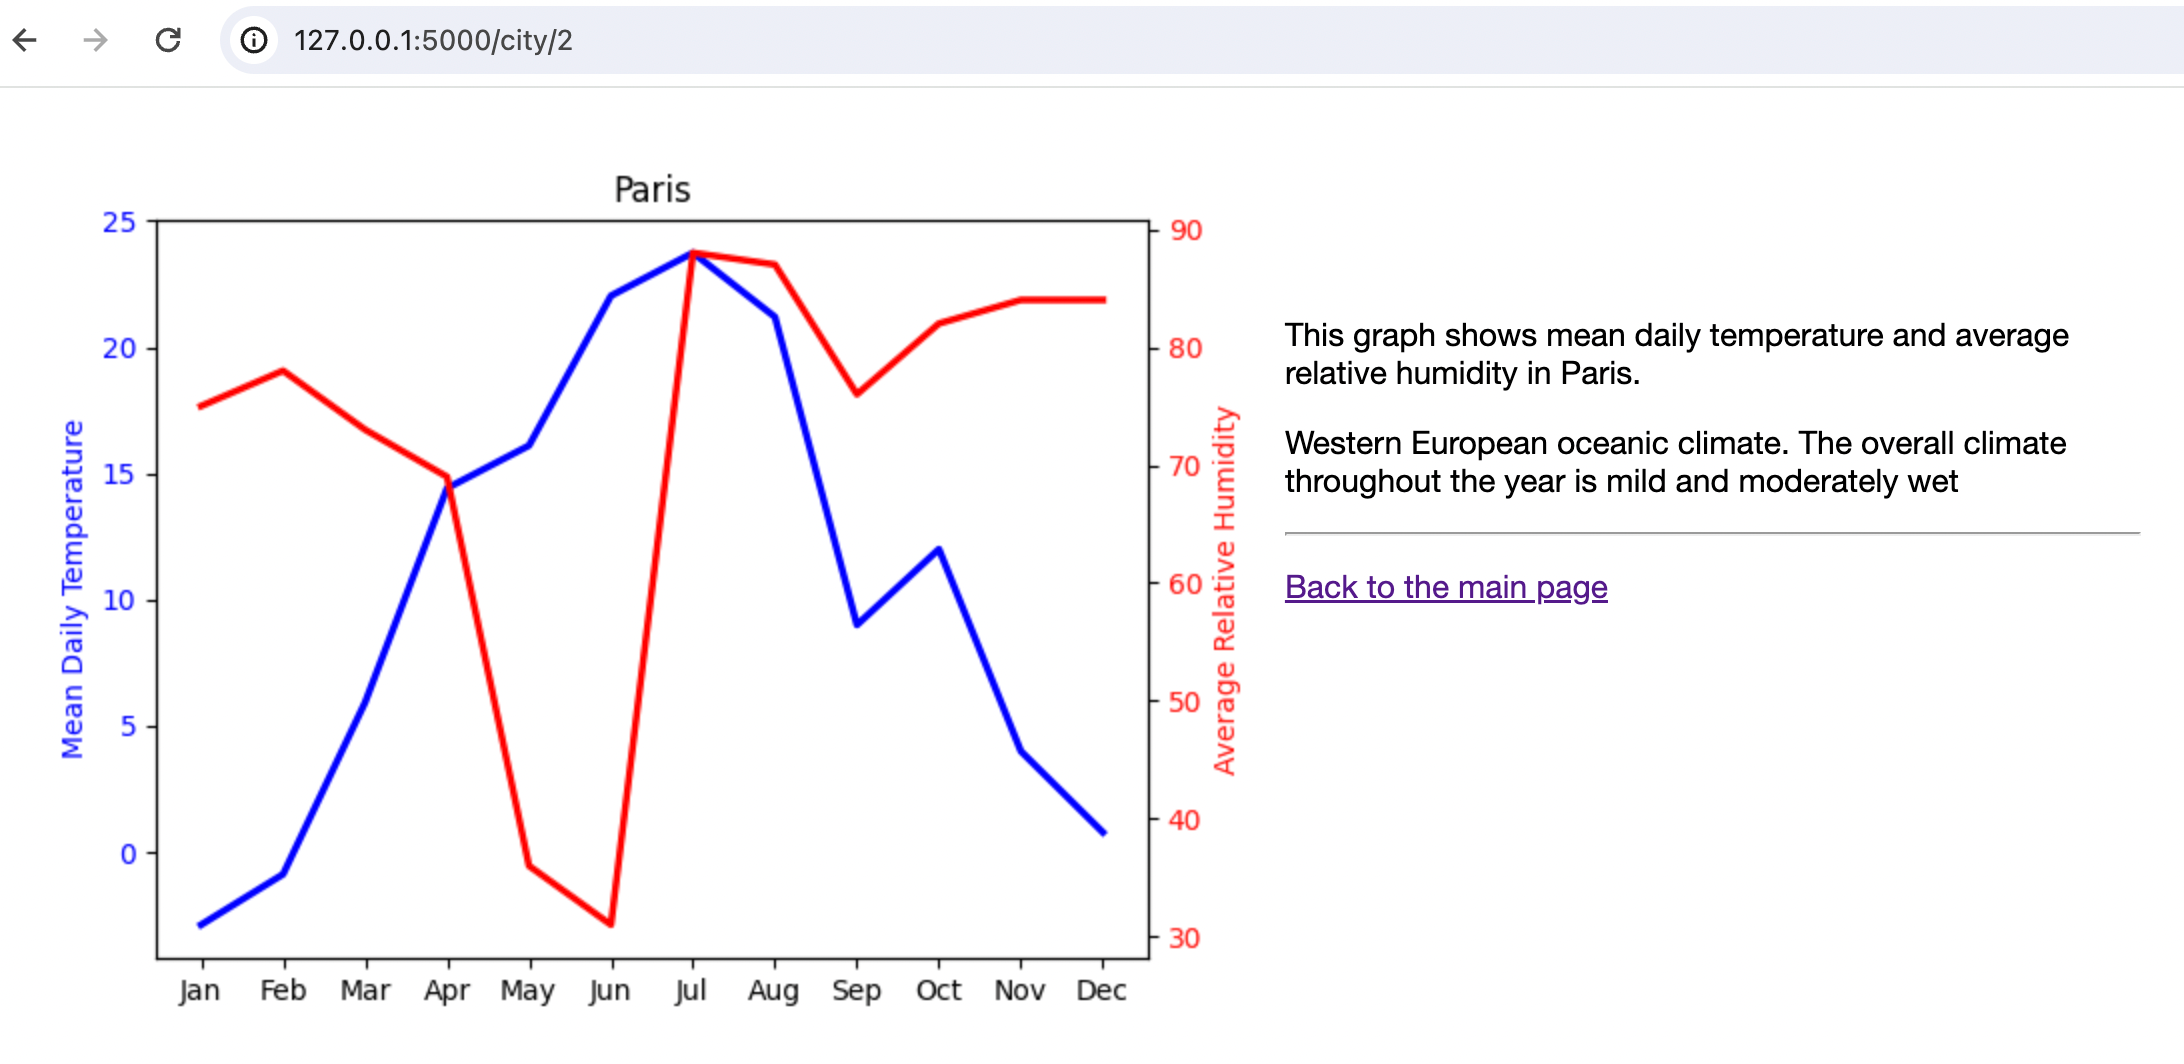
折线图 - 每个城市的平均每月温度和湿度。
不受天气影响:应用概述
您将使用各种Web技术来实现以下应用程序功能:
功能 | 技术 |
|---|---|
气象数据操作 | SQLite数据库存储数据,SQLAlchemy包在Python代码中与数据库执行操作。 |
图示 | matplotlib包来绘制图表。 |
查看和编辑内容 | |
管理内容 | Flask来编排应用程序内容。 |
MeteoMaster 是一个 Web 应用程序,包含以下组件:
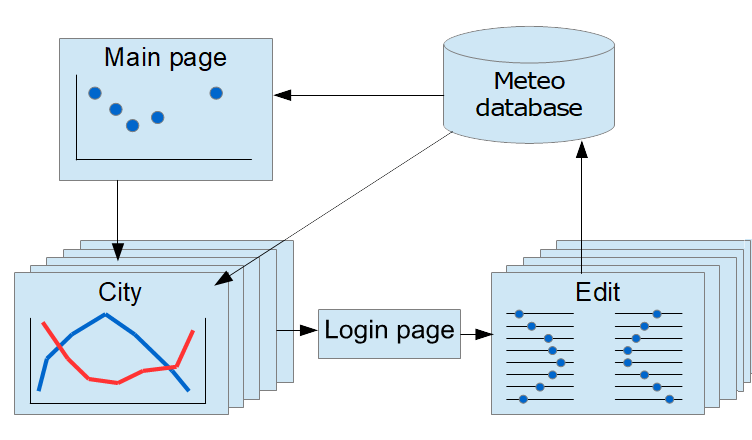
每个 HTML 页面都有一个用 Python 代码实现的相应 Flask 视图。
在 PyCharm 中创建 Flask 应用程序
按照创建 Flask 项目中所述创建一个基本 Flask 项目以开始对应用程序进行原型设计。
在“新建项目”对话框中选择“Flask”。
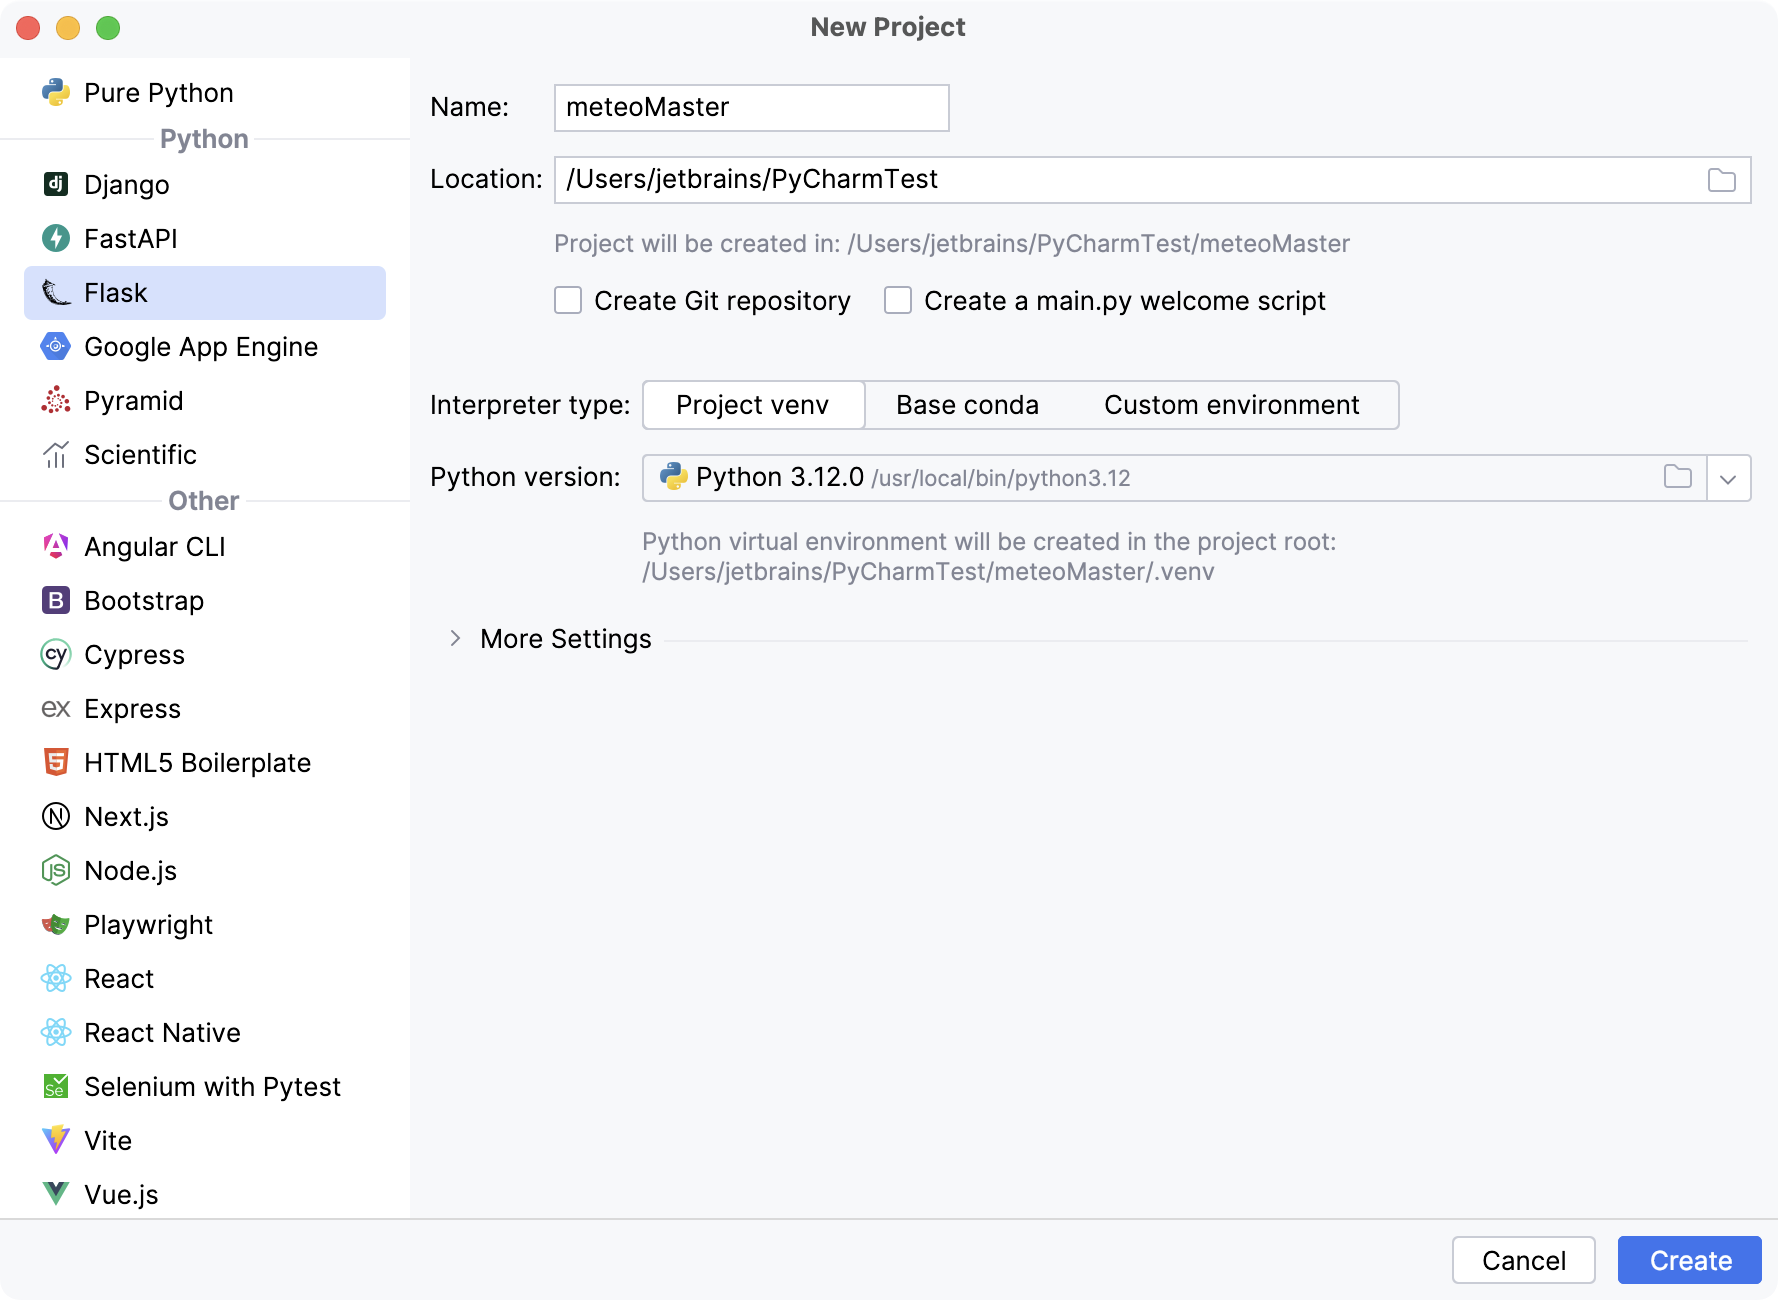
在“位置”字段中,提供项目位置的路径并键入MeteoMaster作为项目名称。将其余设置保留为默认值并保存更改。
按此键运行默认应用程序。在“运行”工具窗口中,单击超链接并预览目标页面。ShiftF10

现在安装 MeteoMaster 应用程序所需的所有软件包。最简单的方法是使用项目依赖项(请参阅使用requirements.txt)。右键单击项目根目录并选择新建 | 文件,然后指定requirements.txt作为文件名并向其中添加以下依赖项列表。
Click==7.0 cycler==0.10.0 Flask==1.0.2 Jinja2==2.10 kiwisolver==1.0.1 MarkupSafe==1.1.0 matplotlib==3.0.2 numpy==1.15.4 pyparsing==2.3.0 python-dateutil==2.7.5 six==1.11.0 SQLAlchemy==1.2.14 Werkzeug==0.14.1单击安装要求链接继续安装软件包。

设置数据库
现在,为您的应用程序设置数据源。使用 PyCharm,这非常简单。
从以下位置下载包含五个城市气象数据的预定义数据库:
https://github.com/allaredko/flask-tutorial-demo/blob/master/user_database
将user_database文件保存在项目根目录下。
双击添加的文件并打开数据库工具窗口。

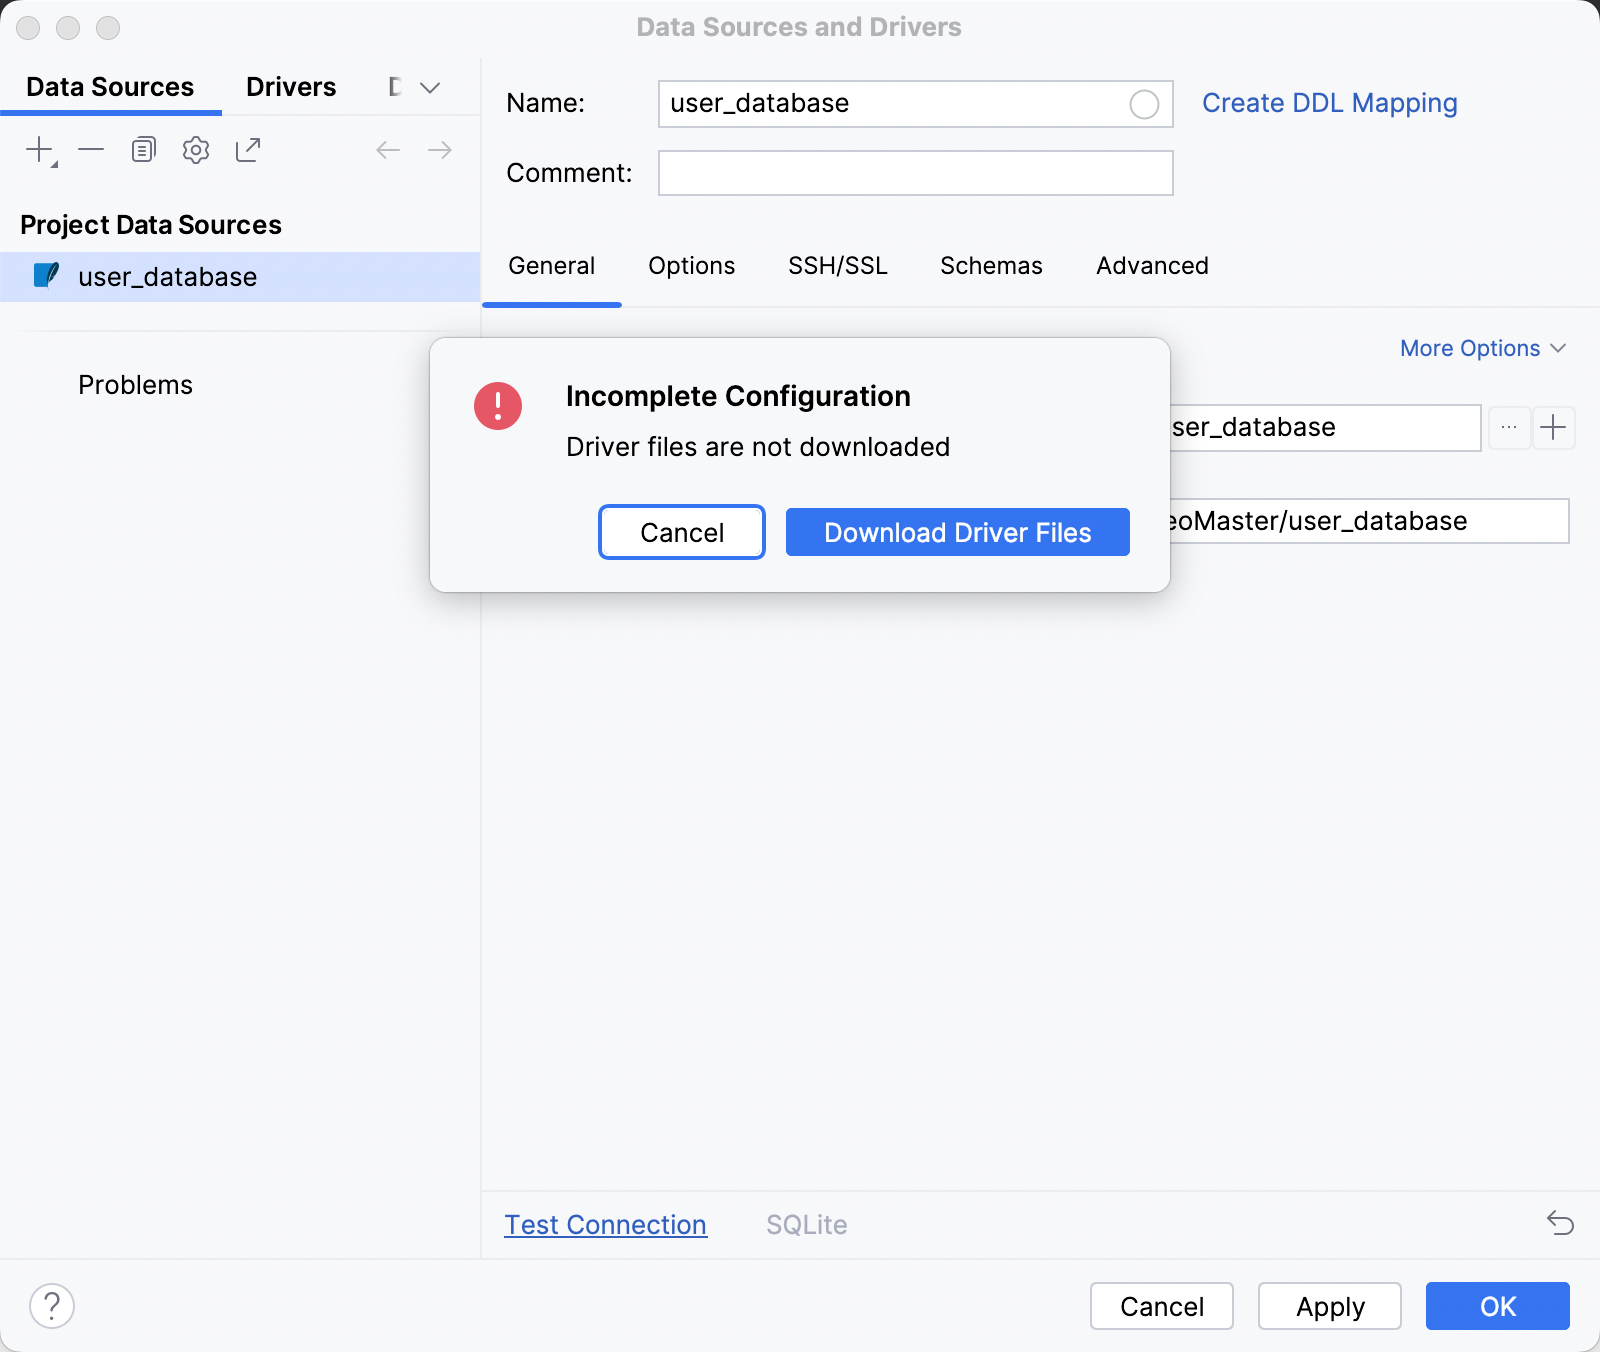
如果您尚未安装 SQLite 数据库驱动程序,请单击
,然后单击警告消息以安装缺少的驱动程序。
您应该在数据库中看到以下表格
user_database:city和meteo。双击每个表以预览数据。该city表包含三列:city_id、city_name和city_climate(城市气候的简短文字描述)。该meteo表有四列:city_id、month、average_humidity和average_temperature。为的列定义外键以设置两个表之间的关系。city_idtable>
或者,右键单击数据库工具窗口中的 user_database并选择Properties。在“数据源和驱动程序”对话框中,单击测试连接以确保数据源已正确配置。
创建一个 Python 文件user_database.py来使用新创建的数据库。使用SQLAlchemy 声明性基本语法来描述数据库。
metadata = MetaData() engine = create_engine('sqlite:///user_database', connect_args={'check_same_thread': False}, echo=False) # echo=False Base = declarative_base() db_session = sessionmaker(bind=engine)() # Table city class City(Base): __tablename__ = 'city' city_id = Column(Integer, primary_key=True) city_name = Column(String) city_climate = Column(String) city_meteo_data = relationship("Meteo", backref="city") # Table meteo class Meteo(Base): __tablename__ = 'meteo' id = Column(Integer, primary_key=True) city_id = Column(ForeignKey('city.city_id')) month = Column(String) average_humidity = Column(Integer) average_temperature = Column(Float)无需手动为代码片段添加导入语句,而是应用建议的快速修复:只需单击灯泡图标(或按)。AltEnter

现在您已经定义了表及其关系,请添加以下函数以从数据库检索数据:
# Retrieving data from the database
def get_cities():
    return db_session.query(City)


# Generating the set of average temperature values for a particular city
def get_city_temperature(city):
    return [month.average_temperature for month in city.city_meteo_data]


# Generating the set of average humidity values for a particular city
def get_city_humidity(city):
    return [month.average_humidity for month in city.city_meteo_data]


data = get_cities()
MONTHS = [record.month for record in data[0].city_meteo_data]
CITIES = [city.city_name for city in data]
笔记
请参阅项目存储库中user_database.py文件的完整代码。
绘制散点图
您已准备好检索数据并构建第一个图表 - 每个城市的年平均温度和湿度的散点图。使用matplotlib库设置图形并分配值。
创建另一个Python文件charts.py ,并粘贴以下代码片段:
import matplotlib.pyplot as plt from user_database import data, get_city_temperature, get_city_humidity, CITIES yearly_temp = [] yearly_hum = [] for city in data: yearly_temp.append(sum(get_city_temperature(city))/12) yearly_hum.append(sum(get_city_humidity(city))/12) plt.clf() plt.scatter(yearly_hum, yearly_temp, alpha=0.5) plt.title('Yearly Average Temperature/Humidity') plt.xlim(70, 95) plt.ylabel('Yearly Average Temperature') plt.xlabel('Yearly Average Relative Humidity') for i, txt in enumerate(CITIES): plt.annotate(txt, (yearly_hum[i], yearly_temp[i])) plt.show()预览图形的最快方法是使用快捷方式。PyCharm 在SciView工具窗口中呈现散点图。您可以使用“绘图”选项卡预览生成的图表。CtrlShiftF10

现在将图形保存到图像中,以便您可以将其添加到应用程序的主页上。替换
plt.show()为使用该函数的片段savefig(img):from io import BytesIO import matplotlib.pyplot as plt from user_database import data, MONTHS, get_city_temperature, get_city_humidity, CITIES def get_main_image(): """Rendering the scatter chart""" yearly_temp = [] yearly_hum = [] for city in data: yearly_temp.append(sum(get_city_temperature(city))/12) yearly_hum.append(sum(get_city_humidity(city))/12) plt.clf() plt.scatter(yearly_hum, yearly_temp, alpha=0.5) plt.title('Yearly Average Temperature/Humidity') plt.xlim(70, 95) plt.ylabel('Yearly Average Temperature') plt.xlabel('Yearly Average Relative Humidity') for i, txt in enumerate(CITIES): plt.annotate(txt, (yearly_hum[i], yearly_temp[i])) img = BytesIO() plt.savefig(img) img.seek(0) return img
创建主页
设置应用程序的主页并创建散点图视图。
将app.py
app.route()文件中的代码片段替换为以下代码:@app.route('/') def main(): """Entry point; the view for the main page""" cities = [(record.city_id, record.city_name) for record in data] return render_template('main.html', cities=cities) @app.route('/main.png') def main_plot(): """The view for rendering the scatter chart""" img = get_main_image() return send_file(img, mimetype='image/png', cache_timeout=0)应用建议的快速修复来添加缺少的导入语句。
请注意,PyCharm 会突出显示main.html,因为您尚未创建此文件。

通过 PyCharm 意图操作,您可以快速创建缺少的模板文件。按并从上下文菜单中选择创建模板 main.html 。确认模板文件的名称和位置,然后单击“确定”。结果,main.html将被添加到templates目录中。打开新添加的文件并将以下代码粘贴到其中:AltEnter
<!DOCTYPE html>
<html lang="en">
<head>
<meta charset="UTF-8">
<link href="../static/style.css" rel="stylesheet" type="text/css">
<title>Typical Climate</title>
</head>
<body>
    <div id="element1">
        <img src="{{ url_for('main_plot') }}" alt="Image">
    </div>
    <div id="element2">
        <p>What city has the best climate?</p>
        <p>When planning your trip or vacation you often check weather data for
                humidity and temperature.</p>
        <p>Below is the collection of the yearly average values for the following cities: </p>
        <ul>
                {% for city_id, city_name in cities %}
                <li><a href="">{{ city_name }}</a></li>
                {% endfor %}
        </ul>
    </div>
</body>
</html>
请注意,
{{ city_name }}此片段中有一个Jinja2模板变量,用于将city_namePython 变量传递到 HTML 模板。还要创建样式表来为应用程序中的所有 HTML 页面设置字体和布局设置。右键单击静态目录并选择新建 | Stylesheet ,然后指定css文件的名称style.css,并粘贴以下样式定义:
body
{
    font-family: "Helvetica Neue", Helvetica, Arial, sans-serif;
}
#element1
{
    display: inline-block;
}

#element2
{
    display: inline-block;
    vertical-align: top;
    margin-top: 90px;
    alignment: left;
    width: 25%;
}
笔记
PyCharm 将自动完成标识符,例如
#element1项目 HTML 文件中使用的标识符。当您第一次运行应用程序时,PyCharm 会自动生成运行/调试配置。您可以随时使用它来运行修改后的应用程序来评估结果。

单击“运行”工具窗口中的http://127.0.0.1:5000/
链接。您应该会看到以下页面:
笔记
您可以在任何代码更改时不断重新运行应用程序。单击可用配置列表并选择编辑配置。在Flask 运行/调试配置对话框中,选中FLASK_DEBUG复选框。启用此模式后,每次保存代码更改时,PyCharm 都会重新启动正在运行的应用程序。Ctrl0S
绘制折线图
为了向应用程序用户提供有关特定城市气候的详细信息,请呈现包含相关信息的折线图。
修改charts.py文件,添加以下
get_city_image函数:def get_city_image(city_id): """Rendering line charts with city specific data""" city = data.get(city_id) city_temp = get_city_temperature(city) city_hum = get_city_humidity(city) plt.clf() plt.plot(MONTHS, city_temp, color='blue', linewidth=2.5, linestyle='-') plt.ylabel('Mean Daily Temperature', color='blue') plt.yticks(color='blue') plt.twinx() plt.plot(MONTHS, city_hum, color='red', linewidth=2.5, linestyle='-') plt.ylabel('Average Relative Humidity', color='red') plt.yticks(color='red') plt.title(city.city_name) img = BytesIO() plt.savefig(img) img.seek(0) return img此函数绘制两个线性图表:每个城市的月平均日气温和平均相对湿度。与该函数类似
get_main_image,它将图表保存在图像中。再创建一个.html文件来显示折线图。
右键单击项目根目录中的模板目录,然后选择“新建”|“模板”。HTML File,然后输入city.html作为文件名,并将以下代码粘贴到新创建的文件中:
<!DOCTYPE html>
<html lang="en">
<head>
    <meta charset="UTF-8">
    <link href="../static/style.css" rel="stylesheet" type="text/css">
    <title>{{ city_name }}</title>
</head>
<body>
    <div id="element1">
        <img src="{{ url_for('city_plot', city_id=city_id) }}" alt="Image">
    </div>
    <div id="element2">
        <p>This graph shows mean daily temperature and average relative humidity in {{ city_name }}.</p>
        <p> {{ city_climate }}</p>
        <hr/>
        <p><a href="/">Back to the main page</a></p>
    </div>
</body>
</html>
剩下的步骤是使用该函数创建另外两个视图
Flask.route。将以下代码片段添加到app.py文件中:@app.route('/city/<int:city_id>') def city(city_id): """Views for the city details""" city_record = data.get(city_id) return render_template('city.html', city_name=city_record.city_name, city_id=city_id, city_climate=city_record.city_climate) @app.route('/city<int:city_id>.png') def city_plot(city_id): """Views for rendering city specific charts""" img = get_city_image(city_id) return send_file(img, mimetype='image/png', cache_timeout=0,)不要忘记使用快速修复来添加缺少的导入语句。AltEnter
现在修改main.html文件以使用相应city/*页面的链接填充城市列表。
<li><a href="">{{ city_name }}</a></li>用。。。来代替<li><a href="{{ url_for('city', city_id=city_id) }}">{{ city_name }}</a></li>。
重新运行运行/调试配置以重新启动应用程序,然后单击指向巴黎的链接。您应该会导航到city/2页面。
创建登录表单
此时,您已经创建了一个功能齐全的应用程序,可以从数据库中检索气象数据并将其呈现为图表。然而,在现实生活中,您通常想要编辑数据。合理地说,编辑应该只允许授权用户进行,因此,让我们创建一个登录表单。
右键单击项目根目录中的模板目录,然后选择“新建”|“模板”。HTML File,然后输入login.html作为文件名,并将以下代码粘贴到新创建的文件中:
<!DOCTYPE html> <html lang="en"> <head> <meta charset="UTF-8"> <link rel="stylesheet" type="text/css" href="../static/style.css"> <title>Login form </title> </head> <body> <p>Login to edit the meteo database: </p> <div class="container"> <form action="" class="form-inline" method="post"> <input type="text" class="form-control" placeholder="Username" name="username" value="{{ request.form.username }}"> <input type="password" class="form-control" placeholder="Password" name="password" value="{{ request.form.password }}"> <input class="btn btn-default" type="submit" value="Login"> </form> <p>{{ error }} </p> </div> </body> </html>此代码实现了带有用户名和密码字段的典型登录表单。
将以下代码添加到app.py文件中,为登录表单创建 Flask 视图并控制登录会话。
@app.route('/login/<int:city_id>', methods=["GET", "POST"]) def login(city_id): """The view for the login page""" city_record = data.get(city_id) try: error = '' if request.method == "POST": attempted_username = request.form['username'] attempted_password = request.form['password'] if attempted_username == 'admin' and attempted_password == os.environ['USER_PASSWORD']: session['logged_in'] = True session['username'] = request.form['username'] return redirect(url_for('edit_database', city_id=city_id)) else: print('invalid credentials') error = 'Invalid credentials. Please, try again.' return render_template('login.html', error=error, city_name=city_record.city_name, city_id=city_id) except Exception as e: return render_template('login.html', error=str(e), city_name=city_record.city_name, city_id=city_id) def login_required(f): @wraps(f) def wrap(*args, **kwargs): """login session""" if 'logged_in' in session: return f(*args, **kwargs) else: pass return redirect(url_for('login')) return wrap app.secret_key = os.environ['FLASK_WEB_APP_KEY']使用快捷方式添加缺少的导入语句。请注意,此代码片段引入了两个环境变量:和。AltEnter
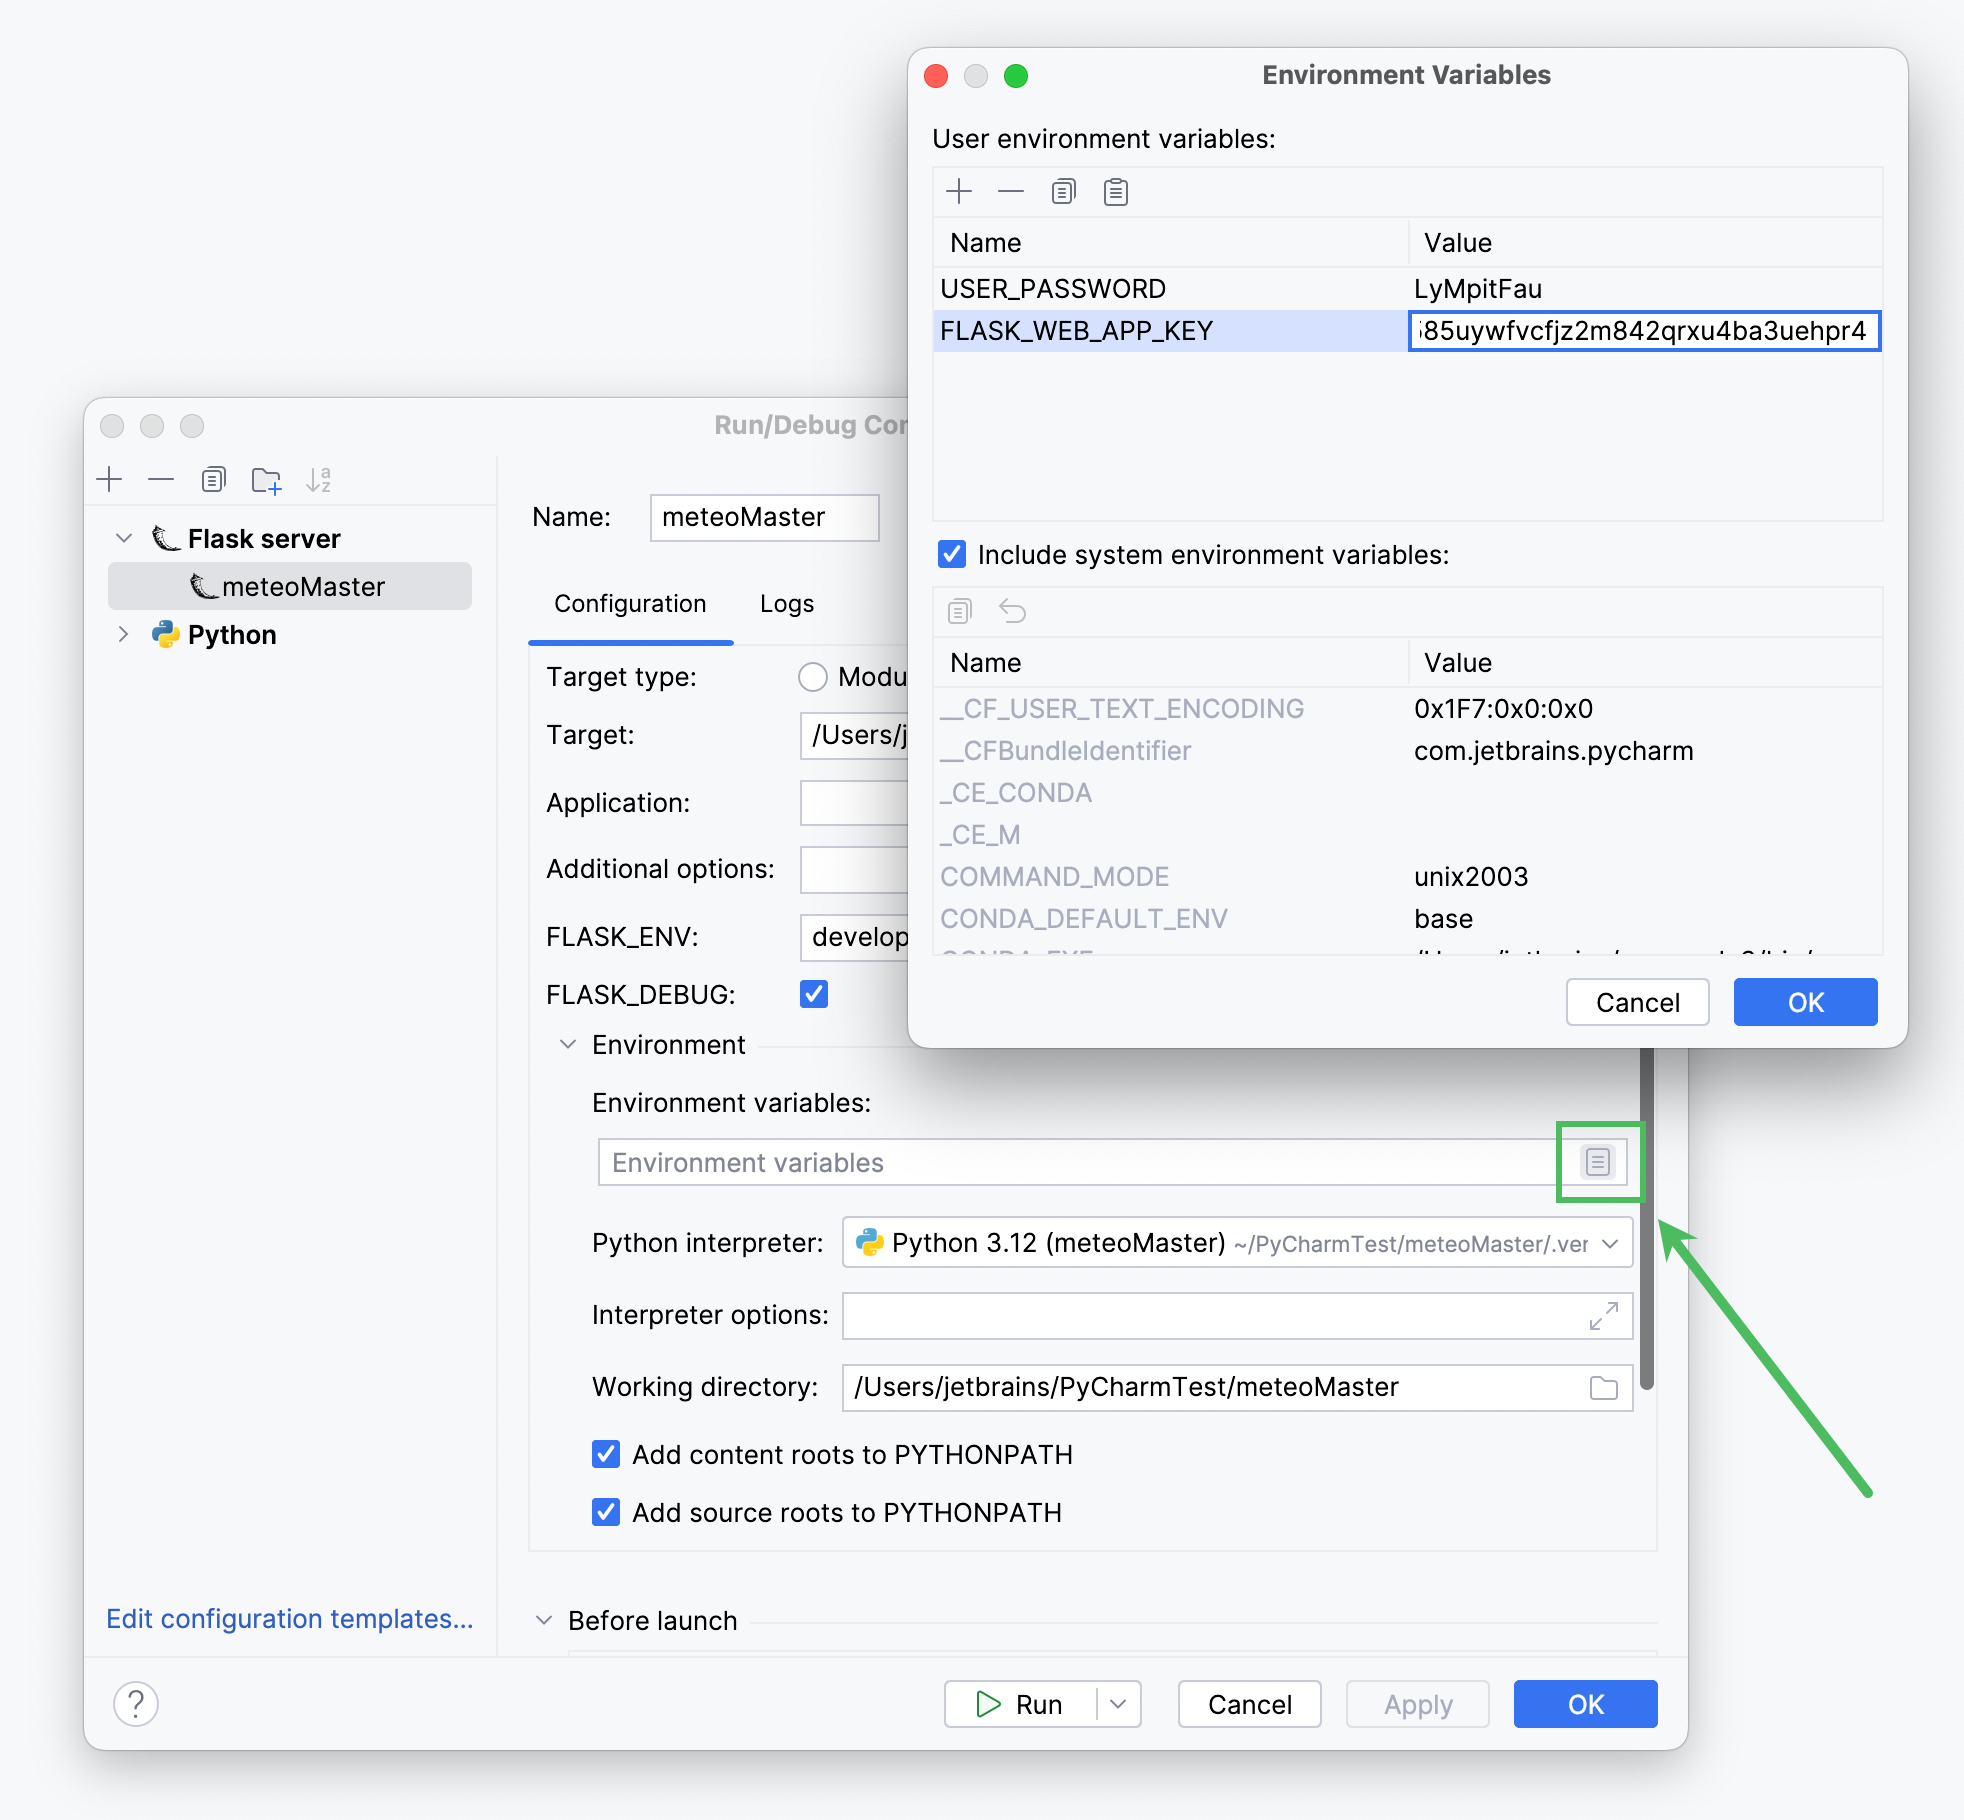
USER_PASSWORDFLASK_WEB_APP_KEY您可以在MeteoMaster运行/调试配置中记录新创建的环境变量的值,因为与在app.py文件中硬编码相比,这是存储安全敏感信息的更安全的方法。
转到编辑器右上角的运行/调试配置列表,然后选择编辑配置。单击环境变量
字段中的图标并添加两个变量。
修改city.html
<div id="element2">文件中的元素以适应登录功能:<p>This graph shows mean daily temperature and average relative humidity in {{ city_name }}.</p> <p> {{ city_climate }}</p> {% if session['logged_in'] %} <p>Want to add more data?</p> <p>Go and <a href="{{ url_for('edit_database', city_id=city_id) }}">edit</a> the meteo database.</p> {% else %} <p>Want to edit meteo data?</p> <p>Please <a href="{{ url_for('login', city_id=city_id) }}">login</a> first.</p> {% endif %} <hr/> <p><a href="/">Back to the main page</a></p>重新启动应用程序并单击任意城市链接,然后单击“请先登录”语句中的登录链接。您应该会看到登录表单。
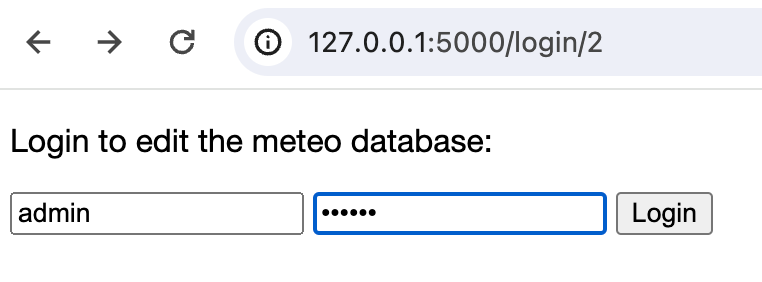
该表单暂时无法编辑,因为您还没有实现相应的页面。同时,您可以尝试输入任何错误的密码,检查是否已处理,并显示消息:“无效的凭据。请重试。”
编辑数据
最后剩下的步骤是启用气象数据的编辑。
右键单击项目根目录中的模板目录,然后选择“新建”|“模板”。HTML File,然后输入edit.html作为文件名,并将以下代码粘贴到新创建的文件中:
<!DOCTYPE html>
<html lang="en">
    <head>
        <meta charset="UTF-8">
        <link rel="stylesheet" type="text/css" href="../static/style.css">
        <title>Edit meteo data for {{ city_name }}</title>
    </head>
    <body>
        <p>Edit the data for {{ city_name }} as appropriate:</p>
        <div class="container">
            <form name="meteoInput" action="" class="form-inline" method="post">
                <table>
                    <tr>
                        <td>Month</td>
                        <td colspan="2" align="center">Average Temperature</td>
                        <td colspan="2" align="center">Average Humidity</td>
                    </tr>
                    {% for month in months %}
                    <tr>
                        <td>{{ month }}</td>
                        <td>
                            <input placeholder="20" class="form-control" name="temperature{{ loop.index0 }}"
                                   value="{{ meteo[0][loop.index0]}}" type="range" min="-50.0" max="50.0" step="0.01"
                                   oninput="temp_output{{ loop.index0 }}.value=this.value" >
                        </td>
                        <td>
                            <output name="temp_output{{ loop.index0 }}">{{ '%0.2f' % meteo[0][loop.index0]|float }}</output>
                            <label> C</label>
                        </td>
                        <td>
                            <input placeholder="20" class="form-control" name="humidity{{ loop.index0 }}"
                                   value="{{ meteo[1][loop.index0]}}" type="range" min="0" max="100"
                                   oninput="hum_output{{ loop.index0 }}.value=this.value">
                        </td>
                        <td>
                            <output name="hum_output{{ loop.index0 }}">{{ meteo[1][loop.index0]}}</output>
                            <label> %</label>
                        </td>
                    </tr>
                    {% endfor %}

                </table>
                <input class="btn btn-default" type="submit" value="Save">
            </form>
            <p>{{ error }}</p>
        </div>
    </body>
</html>
该片段还利用 Jinjia2 模板来处理输入数据并将其传递给执行数据库提交的 Python 代码。
在app.py文件中再添加一个代码片段,用于为编辑页面创建 Flask 视图、处理输入数据并更新数据库:
@app.route('/edit/<int:city_id>', methods=["GET", "POST"]) @login_required def edit_database(city_id): """Views for editing city specific data""" month_temperature = [] month_humidity = [] city_record = data.get(city_id) meteo = [get_city_temperature(city_record), get_city_humidity(city_record)] try: if request.method == "POST": # Get data from the form for i in range(12): # In a production application we ought to validate the input data month_temperature.append(float(request.form[f'temperature{i}'])) month_humidity.append(int(request.form[f'humidity{i}'])) # Database update for i, month in enumerate(city_record.city_meteo_data): month.average_temperature = month_temperature[i] month.average_humidity = month_humidity[i] db_session.commit() return redirect(url_for('main', city_id=city_id)) else: return render_template('edit.html', city_name=city_record.city_name, city_id=city_id, months=MONTHS, meteo=meteo) except Exception as error: return render_template('edit.html', city_name=city_record.city_name, city_id=city_id, months=MONTHS, meteo=meteo, error=error)不要忘记添加缺少的导入语句。请参阅项目存储库中app.py文件的完整代码。
通过这一步,您已经完成了创建与数据库交互的基于 Flask 的应用程序的任务。现在你已经完全掌控了天气。去修改任何城市的气象数据,使变化在图表上突出。然后预览更改。
感谢您的反馈意见!