问题工具窗口
最后修改时间:2023 年 11 月 20 日查看 | 工具窗口 | 问题
Alt06
问题工具窗口使用多个选项卡显示 PyCharm 在项目中检测到的问题。
您可以在窗口中选择任何问题,然后按或双击它以跳转到编辑器中的相应行。F4
启用设计时代码检查后,此选项卡会列出当前文件中发现的所有代码问题。当您在编辑器中的文件之间切换时,该列表会更新。

工具栏
物品 | 工具提示和快捷方式 | 描述 |
|---|---|---|
查看选项 | 按严重性过滤掉代码问题并配置其排序。如果未选择分组或排序选项,问题将按照它们在文件中出现的顺序列出。 | |
显示快速修复AltEnter | 显示可用于所选问题的快速修复。 | |
打开编辑器预览 | 打开预览窗格以在“问题”窗口中的源上下文中查看所选问题。请注意,此预览是一个普通编辑器,您可以在其中更改代码并应用可用的快速修复。 |
上下文菜单
物品 | 捷径 | 描述 |
|---|---|---|
显示快速修复 | AltEnter | 显示可用于所选问题的快速修复。 |
复制问题描述 | Ctrl0C | 将问题描述复制到剪贴板。 |
跳转至源代码 | F4 | 在编辑器中打开包含问题的代码。 |
显示错误详细信息 | 在单独的对话框中打开错误详细信息。 |
Click Inspect Code to run code inspections manually. The results will be shown in the Inspection Results tab.

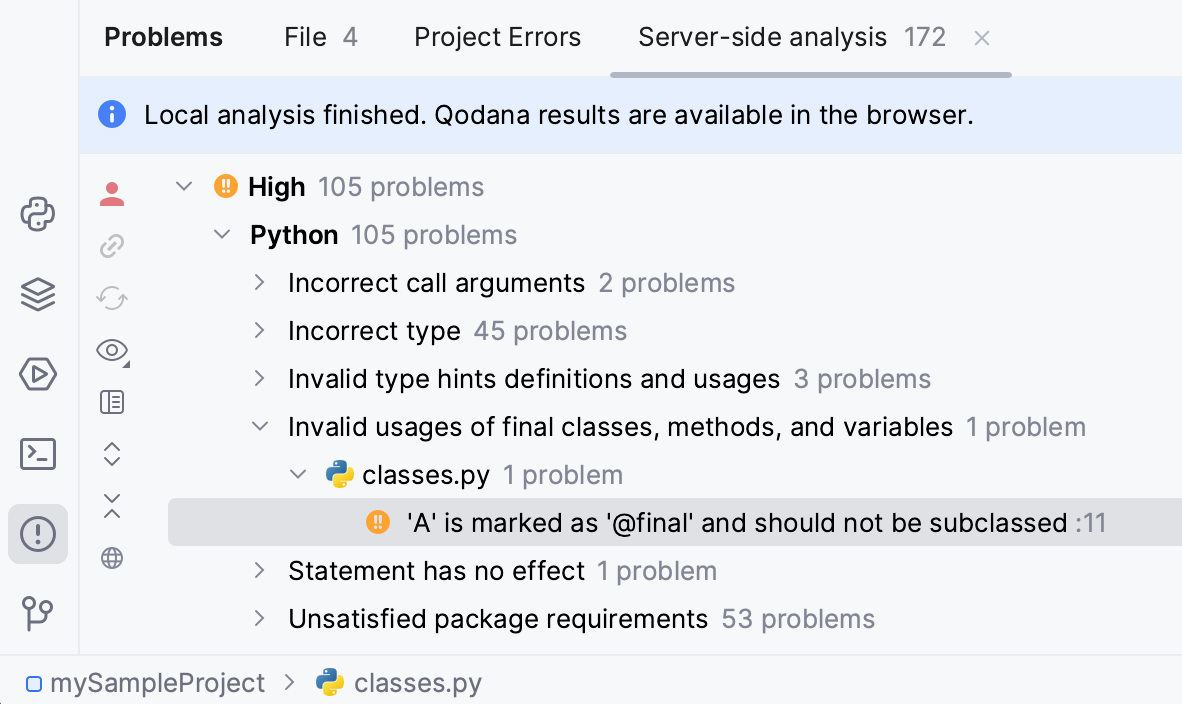
This tab displays code problems detected with Qodana. Qodana allows you run inspections locally including your IDE, and as a part of CI/CD pipelines.

Toolbar
Item | Tooltip and shortcut | Description |
|---|---|---|
Log in to Qodana | Log in to Qodana Cloud. This action is a prerequisite for linking your project with Qodana Cloud-based reports. Alternatively, you can do it from the main menu: Tools | Qodana | Log in to Qodana. For more information, refer to Qodana Cloud. | |
Logged in to Qodana | You are logged in to Qodana Cloud. You can link your project with Qodana Cloud. | |
Link Project with Cloud | Link your project and upload the report to Qodana Cloud. Alternatively, you can do it from the main menu: Tools | Qodana | Link Project with Cloud. For more information, refer to Open report from Qodana Cloud. | |
Linked with Cloud | Your project is linked with Qodana Cloud. By clicking this button, you can open the inspection report in the cloud or unlink your project from Qodana Cloud. | |
Refresh Cloud Report | Refresh the current cloud report. | |
View Options | Filter out code issues by their severity and configure their sorting. When no grouping or sorting options are selected, the issues are listed in the order they appear in the file. | |
Open Editor Preview | Open the preview pane to view the selected issue in its source context right in the Problems window. Note that this preview is a normal editor where you can change the code and apply available quick-fixes. | |
Expand All CtrlNumPad + | Expand all nodes. | |
Collapse All CtrlNumPad - | Collapse all nodes. | |
Show Qodana in Browser | Open the results of the analysis in your default browser. An interactive report opens allowing you to examine the problems in detail and navigate between the report and the IDE. |
Context menu options
Item | Shortcut | Description |
|---|---|---|
Show Quick-Fixes | AltEnter | Show quick-fixes available for the selected problem. |
Jump to Source | F4 | Open the code with the problem in the editor. |
Show Error Details | Learn more in formation about the detected problem in a popup. | |
qodana.yaml | Modify the qodana.yaml configuration file by excluding from the analysis certain files, folders, or inspections. |
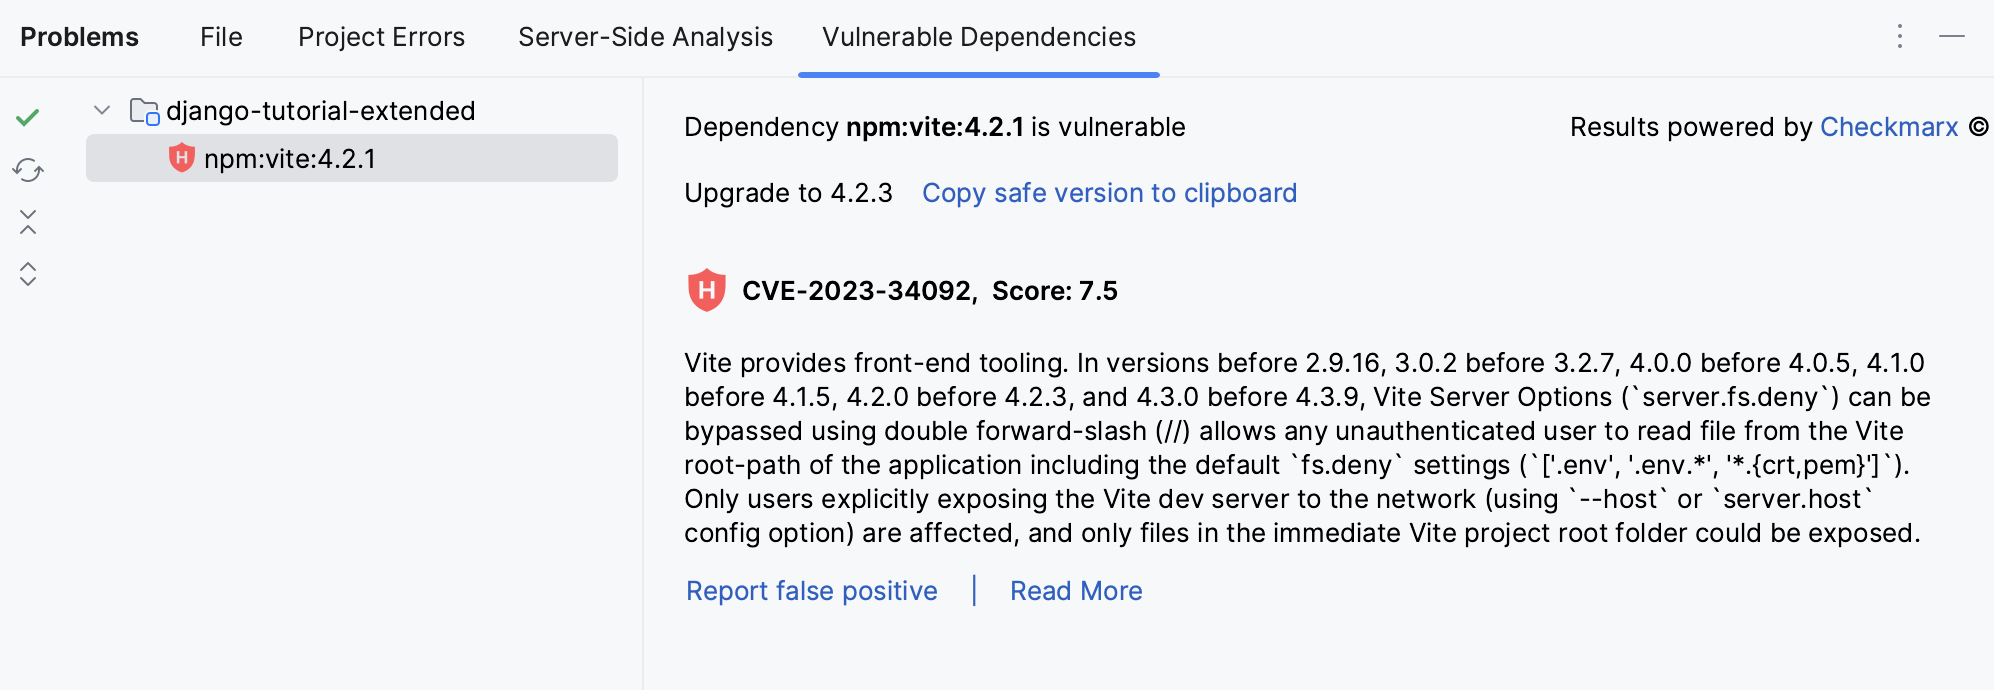
This tab displays usages of vulnerable API that are found in imported dependencies. Vulnerability data is provided by Checkmarx.

Toolbar
Item | Tooltip and shortcut | Description |
|---|---|---|
Show Safe | Show safe dependencies in the list along with vulnerable dependencies. | |
Refresh | Check the current dependencies and refresh the list in the Problems tool window. | |
Expand All CtrlNumPad + | Expand all nodes. | |
Collapse All CtrlNumPad - | Collapse all nodes. |
Action links in the results pane
Item | Description |
|---|---|
Copy safe version to clipboard | Copy the version that includes a fix for the vulnerability to the clipboard. |
Report false positive | Inform JetBrains about inaccuracies in the dependency vulnerability checker. Dependency vulnerability checker automatically scans your code to identify potential issues such as security vulnerabilities in your dependencies. However, like any automated tools, they may sometimes identify an issue that is not really a problem (a "false positive"). The Report false positive option allows users to report these inaccuracies back to the developers of the IDE. |
Read more | Open the Developer Hub by Checkmarx site to learn more about the vulnerability. |
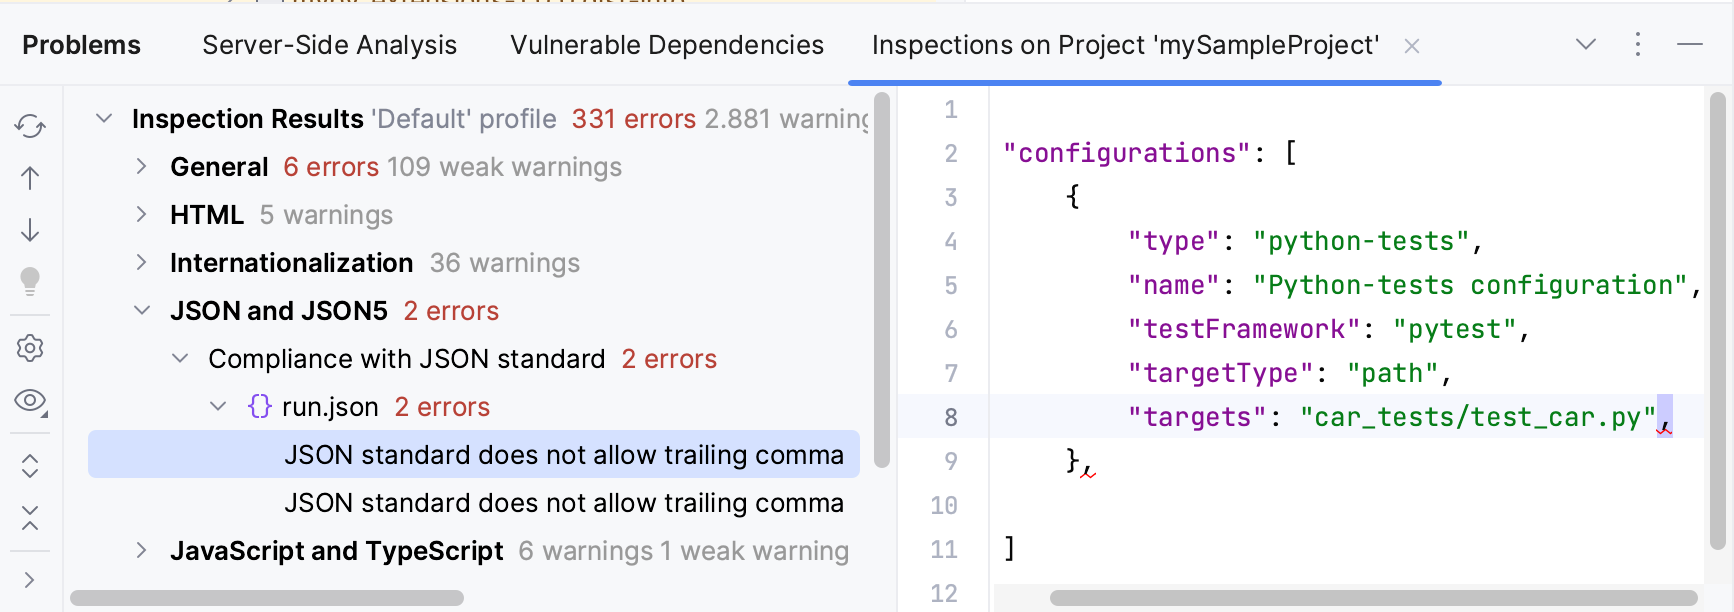
This tab appears when you run code inspections manually and shows the analysis results.

Toolbar
Item | Shortcut | Description |
|---|---|---|
CtrlF5 | Run the inspection and show the results on the same tab. | |
CtrlAlt0↑ | Navigate to the previous problem. | |
CtrlAlt0↓ | Navigate to the next problem. | |
AltEnter | Resolve the problem for the selected inspection item by choosing one of the available quick fixes from the list. | |
Change the settings for the selected inspection or group of inspections in the Errors dialog. | ||
Group or filter found problems according to the selected option:
| ||
CtrlNumPad + | Expand all nodes. | |
CtrlNumPad - | Collapse all nodes. | |
Export the inspection results into XML , Sarif, or HTML format. |
Context menu options
Item | Shortcut | Description |
|---|---|---|
Jump to Source | F4 | Open the file that contains the selected problem in the editor and place the caret at the beginning of the corresponding code fragment. |
Exclude | Delete | Exclude the selected items from further examination. Excluded nodes are shown strikethrough. If the filter toggle |
Include | Insert | Include previously excluded items in the list of results. All nested elements are included too. |
| AltEnter | Select one of the suggested solutions. |
Suppress problem | Suppress the inspection for the selected problem or the selected class. | |
Edit Settings | Change the settings for the selected inspection or group of inspections in the Errors dialog. | |
Disable inspection | Disable alerts for the selected inspection in the active tab of results. If the filter toggle | |
Run inspection on | Rerun the selected inspection and display the results on a new tab. |
Inspection report
The inspection report is shown in the right pane of the results tab when an inspection node is selected in the left pane. The report may include the following:
Problem resolution: A button for each of the available solutions. Clicking a button invokes the corresponding fix. If no buttons are present, you have to fix the problem yourself.
Suppress: Click this button to reveal the list of inspection suppress options.
Problem synopsis: A brief description of the problem.
Disable inspection: Disable alerts for the selected inspection in the active tab of results. If the filter toggle
is on, the nodes for disabled inspections are hidden.
Run inspection on: Rerun the selected inspection and display the results on a new tab.
感谢您的反馈意见!